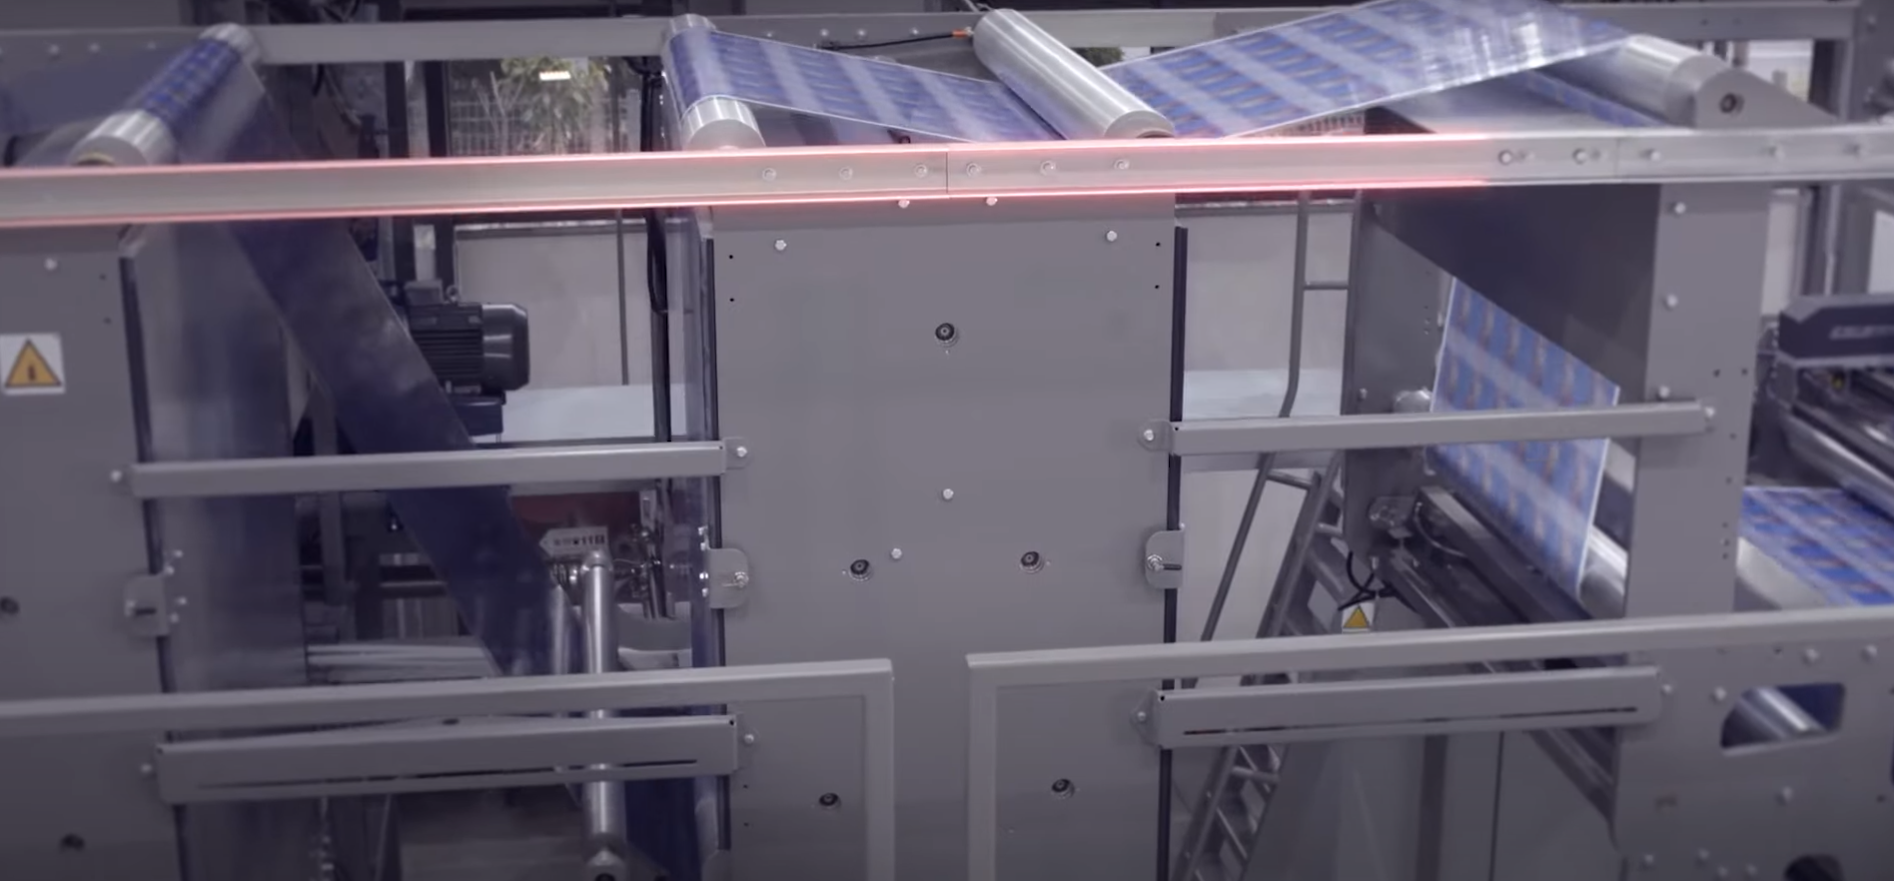
Client: Rieusset Location: Santa Perpétua de Mogoda, Barcelona, España Sector: Impresión Industrial Application: IIoT
Rieusset is a company specialized in industrial label printing for food, textile, pharmaceutical and other industries. It needed to optimize consumption and production costs while reducing its carbon footprint. The monitoring and analysis through IoT and Business Intelligence reports of key aspects such as energy consumption and consumables consumption has allowed the company to achieve the objectives set internally.
Main objective
Reduce supply costs
Proposed method:
IoT, Grafana graphs and Power BI
In depth analysis:
Initial situation:
Rieusset, a company specialized in manufacturing labels for major brands such as Font Vella, Estrella Galicia and Ferrero Rocher needed to monitor, quantify and optimize key parameters of its manufacturing. For this purpose, a data collection system based on an S7 1500 that already collects data from different sources such as energy consumption, level of deposits, air consumption, etc. has been used.
Although they already had the data locally, they needed a system that would allow them to collect it locally:
Store data securely and be able to consult the history.
Live and dynamic data visualization.
Generate warnings and alerts of excess consumption.
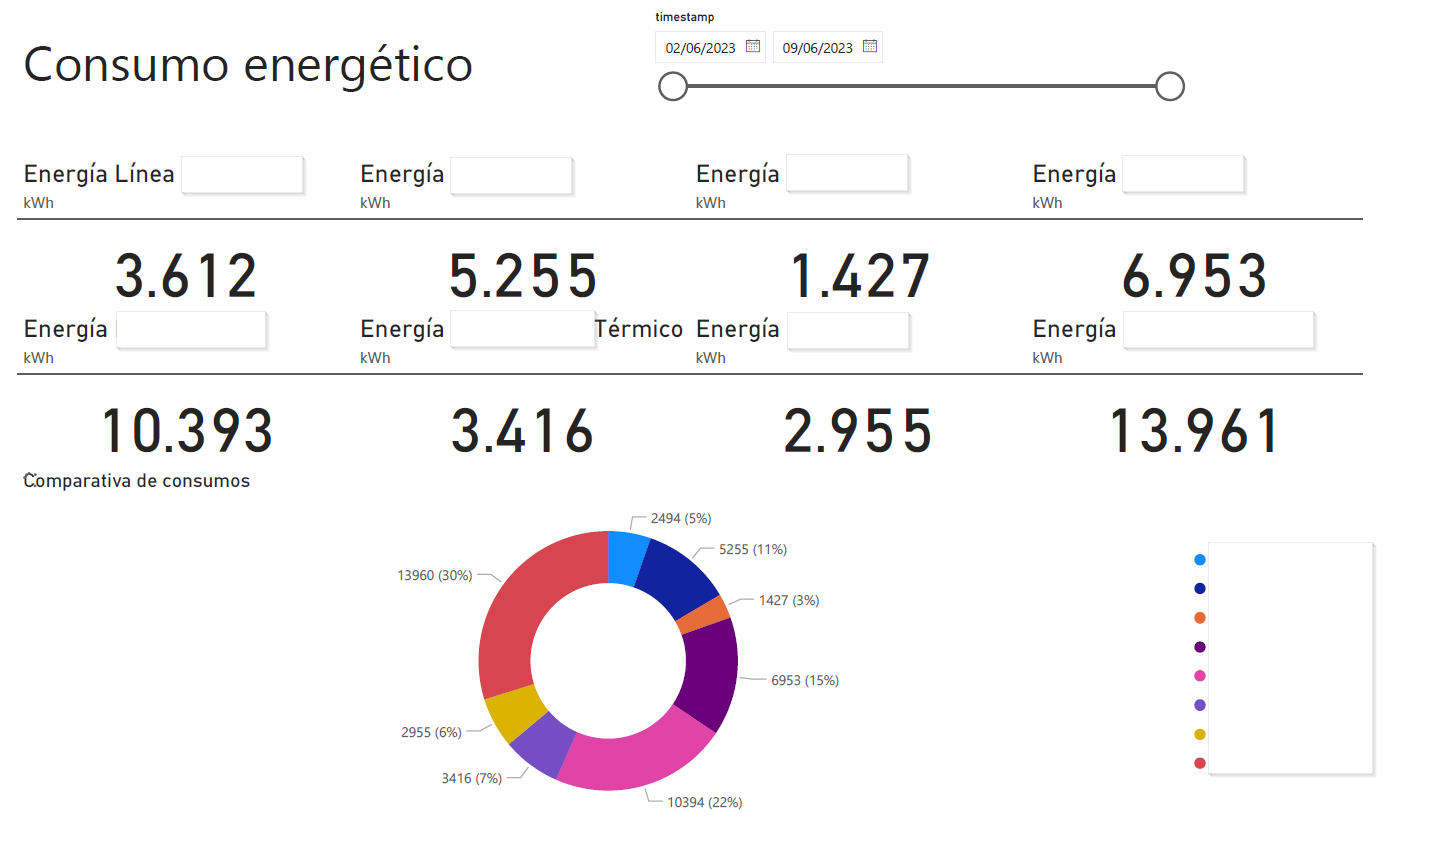
To be able to generate Business Intelligence reports with Power BI that would allow them to clearly analyze the information.
A flexible and scalable system.
Proposed solution:
Our Industrial IoT consulting team has implemented a measurement system composed of temperature, vibration, power consumption and pressure sensors on the air compressor. We used Arduino Machine Control by Arduino PRO to centralize the data acquisition and generate a Modbus TCP to communicate with a gateway that would facilitate the upload of the data to the cloud. These sensors would collect real-time data and transmit it to the gateway via Modbus TCP. The data would then be stored in the amazon cloud (aws) for further analysis and visualization.
We developed a visual interface using Grafana to enable effective understanding and visualization of data collected in the cloud. This solution has provided greater visibility and insight into compressor performance, enabling data-driven decision making and improvements in operational efficiency.
Results:
The search for consumption optimization has made it possible:
The system with cloud connectivity has enabled the company to reduce energy costs, as well as reduce supply costs by implementing optimizations resulting from information analysis. information analysis.
The information obtained has made it possible to detect faults and failures in certain systems that were causing higher than normal consumption. were causing higher than normal consumption. This has resulted in a This has resulted in a 6% decrease in energy consumption.
The Grafana visualization now allows them to consult production history, which helps them to This helps them in the development of new technical and economic proposals.
The system implemented is secure, scalable and flexible, as set out in the objectives to be achieved. to be achieved.
The generation of alerts and warnings has made it possible to reduce response and intervention time in the event of unforeseen events. to unforeseen events.
Usamos cookies en nuestro sitio web para brindarle la experiencia más relevante recordando sus preferencias y visitas repetidas. Al hacer clic en "Aceptar todo", acepta el uso de TODAS las cookies. Sin embargo, puede rechazarlas haciendo click en "Rechazar cookies"
This website uses cookies to improve your experience while you navigate through the website. Out of these, the cookies that are categorized as necessary are stored on your browser as they are essential for the working of basic functionalities of the website. We also use third-party cookies that help us analyze and understand how you use this website. These cookies will be stored in your browser only with your consent. You also have the option to opt-out of these cookies. But opting out of some of these cookies may affect your browsing experience.